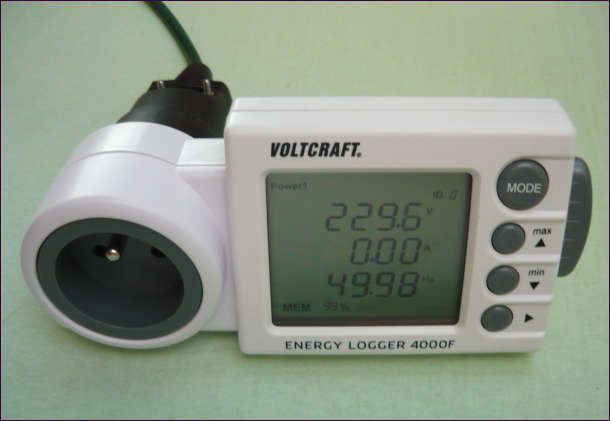
Energy logger 4000 measures and stores electrical values of attached devices.
It can also copy the data on a SD card, which may be used to data transfer on a PC.
With the add in software we can see graphical evaluation of the measured data.
The storage capacity is enough for 6 month and independent from power suply.
This device has its own clock with date and time powered by a 3V CR1620 cell.
Pushing the "Mode" button we walk through the displays:
Display 1: voltage[V], current[A], frequency[Hz], currently, max and min values.
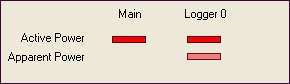
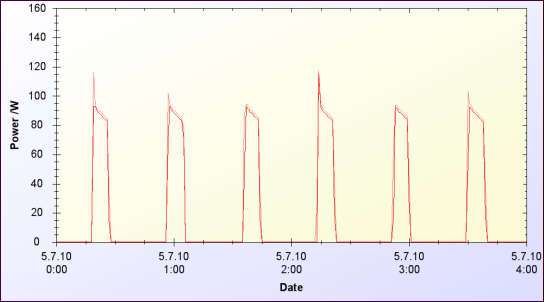
Display 2: active power[W], apparent power[VA], cos Phi.
Display 3: energy consumption total, calculated costs (2 unit cost zones by daytime).
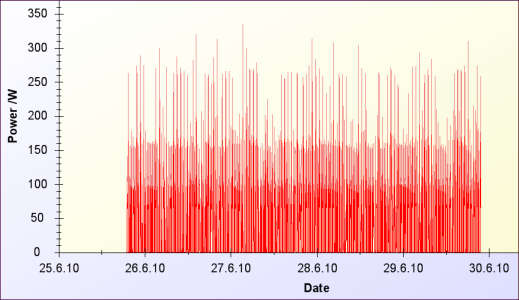
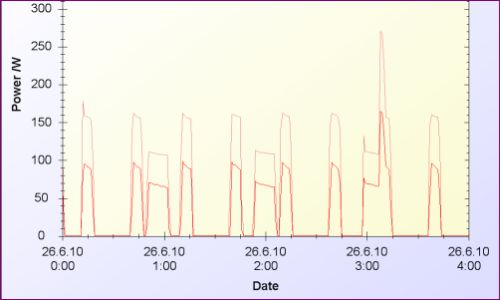
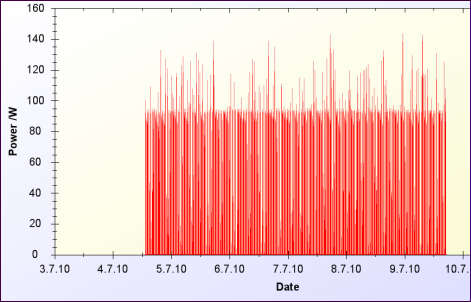
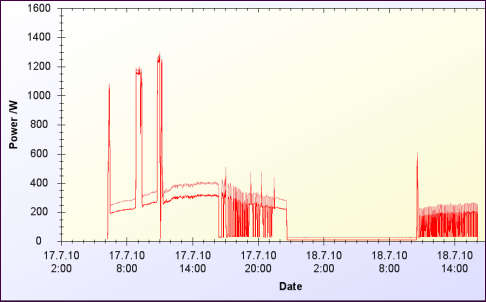
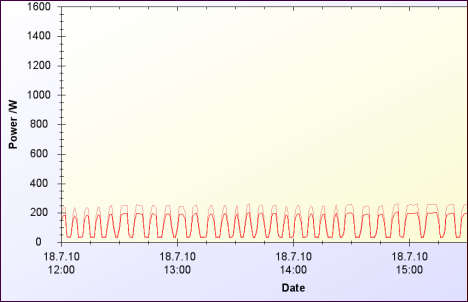
Display 4: history of power consumption day by day.
Display 5: shows recording time and time, when device is on with history function.
Display 6: Forecast of monthly and yearly consumption with costs.